Showing posts with label Kanban Best Practices. Show all posts

Monday, October 5, 2015

Value Stream Mapping As A Process Improvement Tool


#SridharPeddisetty #Agile #PMO #ValueStreamMapping #Lean #Kanban #Value #Stream #Mapping #BestPractices #ProcessImprovement  

“If you can't describe what you are doing as a process, you don't know what you are doing” 
― W. Edwards Deming

What is Value Stream Mapping?

Value Stream Mapping is a lean tool, which employs a flow diagram documenting in detail every step of a process. It is the fundamental tool to identify waste, reduce process cycle times, and implement process improvement.

Why use Value Stream Mapping?

Organizations no longer compete on product or service but they compete on experience of faster to market with quality results. In order to enable Organizations to achieve their strategic objectives, continuous improvement of the quality of products, services or processes must be ongoing. Value Stream Mappings help identify and eliminate source of waste in an Organization's development ecosystem. It is an invaluable technique to define the current state of a process and analyze it for opportunities to reduce time spent on non-value steps. 

How to use Value Stream Mapping?

Below is an example of how Value Stream Mapping was employed for identifying the wastes in current ‘As Is Process’ and then eliminating the wastes for improving the overall process in ’To Be Process’. 
In the Figure: ‘As Is’ Process, wastes in the process are marked by a triangle identifying where tasks are taking too long either by redundancy or following unecessary steps. Value Stream Mapping provides an opportunity to identify steps in the process, which provides value to the development process and those that do not. 

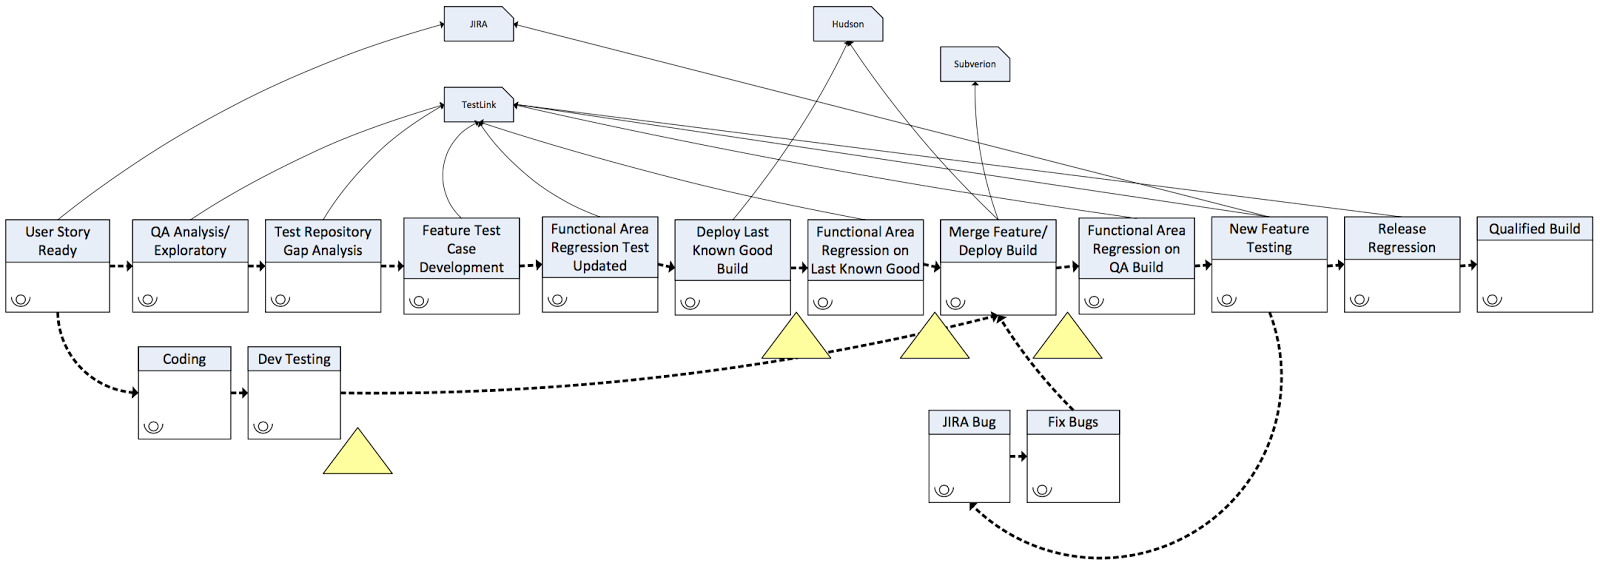
                                                        Figure: 'As Is’ Process
In the Figure: ‘To Be’ Process, wastes are eliminated and Value Stream Mapping is applied to create a future state process that reduces total cycle time


                                                      Figure: ‘To Be’ Process

Summary

Apply the method of Value Stream Mapping to an inefficient process within your organization and learn how to calculate the efficiency of a process from end-to-end. Learn to diagram the 'As Is' process to identify areas of waste and then develop the 'To Be' process that reduces total cycle time. An organization's ability to learn, and translate that learning into action rapidly, is the ultimate competitive advantage and Value Stream Mapping is the tool for providing that efficiency in process improvement. 
"Without continual growth and progress, such words as improvement, achievement, and success have no meaning"- Benjamin Franklin
Value Stream Mapping As A Process Improvement Tool was originally posted under Prokarma Blog on Oct 5th 2015

Tuesday, September 8, 2015

Metrics For Maximizing Productivity In Kanban SDLC


#SridharPeddisetty #Agile #Kanban #SDLC #Productivity #BestPractices #Metrics #EngagementManagement

“Measure what is measurable and make measurable what is not so” –Galileo

In my earlier post Kanban & DevOps - Forming a Perfect Alliance, I had shared the basics of Kanban. In this post, we will look at the metrics for identifying bottlenecks while using Kanban as the software development lifecycle (SDLC) methodology. With experience and motivation to improve quality comes working out the right metrics, which measures areas of continuous improvements. In my earlier post 10 Ground Rules on the Right Metrics for Your Business, I had shared some rules on selecting the right metrics that is tied to the desired business outcomes. As summarized in the blog post, data collection, analysis & management is most often cost and labour intensive, so its important to always weigh in against the benefit derived from the selected metric.

One important principle of Kanban is to maximize productivity by optimizing the flow of work and managing work in progress (WIP) by removing bottlenecks. Before selecting the metrics, we need to assess what metrics is needed and then plan on using the processes and tools, which will provide the data for quantification in a shape and form that will allow us to measure. Presently Organizations are competing to provide faster value to their customers, which is effectively done by sizing and decomposing the requirements into minimal marketable features (MMF).

In Kanban, we can have have the Kanban board visualizing the WIP for states and swim-lanes. States could represent the following phases a user story (feature) or defect goes through the development lifecycle
  • Product Backlog (Requirements)
  • Defined (Analyzed) 
  • In Progress (Development & Testing)
  • Completed
  • Accepted  
while the swim-lanes could represent WIP for 
  • Expedite (Priority) user stories or
  • Defects (Severity 1/2) or
  • Different functional groups such as
    • Architecture,
    • UI/UX Designers,
    • Business Analysts / System Analysts, 
    • Development 
    • Operations
    • DevOps
    • QA
    • Technical Writers
    • others  
In some cases, Kanban board can represent one swim-lane for both expedite and non-expedite user stories or defects while just visualizing states.

Below is a sample ‘Cumulative Mean Lag Time’ metrics, which is measuring the time spent by a user story (USxxxx) or Defect (DExxx) both expedite or non-expedite in each of the following state
  • Requested,
  • Defined,
  • In Progress,
  • Peer Review,
  • In QA, 
  • In UAT and
  • On Hold


From the metrics we can derive following information including identifying bottlenecks and areas of continuous improvement
  • Expedite user stories (US7000 & US7674) are obviously prioritized by the team as the time spent in each state was short comparatively, thus faster overall cycle time. Information can be derived from the chart if the expedite items are distracting the team in effecting their WIP items by looking at the mean lag time an item is spending in each of ‘Defined’ or ‘In Progress’ or ‘On Hold’ states.  
  • User story ‘US7626’ (second chart) was analyzed, developed, peer reviewed and tested in a short span (~2 calendar days) but spent ~9 calendar days in user acceptance test (UAT) state. One reason for this could be that the user story was not in the priority list for the stakeholders to be released or the priority lowered after the work started. As an opportunity for continuous improvement, we can look at the option where there is an opportunity to reprioritize the user story before the team starts the work.  
  • User story ‘US7322’ (first chart) spent a lot of time (~25 calendar days) in ‘Requested’ state and then some time in ‘On Hold’ state (~12 calendar days).  As an opportunity for continuous improvement, we can work with stakeholders to make sure that we are getting the right requirements and acceptance criteria for the user story along with prioritization. The total cycle time for this user story could be also more because of the complexity and/or dependencies on the other integration deliverables. In either case, metrics shows the bottlenecks and provides an opportunity to optimize work flow for future such occurrences. 
  • Above metrics also gives the overall cycle time for different sized user stories and defects, which helps in predicting for future work and ability to give a better commitment for the stakeholders 

Summary
User Story is like a fish, the longer its sits on the shelf, the less desirable it becomes. Use relevant metrics to measure lead time in each of the Kanban columns (states), which helps to identify the bottlenecks and to improve planning and forecasting. 


I will be sharing case studies, process improvements and best practices specific for Kanban in my future posts. Meanwhile let us know if you have any questions or comments. For any questions, please reach out to me at sri_ped@yahoo.com 

Metrics For Maximizing Productivity In Kanban SDLC was originally posted under Prokarma Blog on Sep 8th 2015

Tuesday, September 1, 2015

Kanban & DevOps - Forming a Perfect Alliance

Introduction 
"It is not the strongest of the species that will survive, or the most intelligent. It is the one most adaptable to change.” - Charles Darwin

As Organizations are going through a disruption phase including disruptive innovations with processes and technologies, there is wide adoption of Agile based transformation. In the context of the transformation, there is no better time of coming together of DevOps and Kanban, both of which enable Organizations to be more Agile in delivering services to their customers. 

What is Kanban?
Kanban is one of the lightweight Agile based methodology, which is based on Just-In-Time (JIT) software development. In Kanban based SDLC, the process from requirements of a task to its delivery to the customer, is visualized and team pulls work from a work item pool or queue. 
Kanban is based on simple 3 principles including
  • Visualize Work In Progress (WIP)
  • Limit the WIP
  • Maximize Productivity (by minimizing lead time)
Engineering team does not have time constraints in Kanban while focus is on making sure the work keeps flowing by limiting maximum number of features or issues, which can be worked on at a given time.

What is DevOps?
DevOps formulates collaboration of Operations and Engineering teams to achieve continuous delivery by participating together in the entire service delivery lifecycle.
While the Engineering team remains focused on
  • Analyzing,
  • Designing,
  • Coding 
  • Testing and
  • Production Support
of new services, the DevOps team combine together for
  • Release management,
  • Provisioning,
  • Configuration management,
  • Systems integration,
  • Monitoring & control and
  • Orchestration
of the new services

How Kanban & DevOps Match Perfectly?
Kanban and DevOps combine together to help bring down the silos between Engineering and Operations teams. Basic principles for Kanban and DevOps remain common in terms of
  • Collaboration,
  • Cooperation,
  • Communication, 
  • Integration and 
  • Automation
while bringing in transparency across the board. Managing a Kanban board provides the level of transparency in visualizing items in each of the work streams while formulating cooperation between teams by communicating dependencies, integration points and identifying items for automation.
A typical Kanban board could have items in following work streams
  • Analysis
  • Design
  • Coding
  • Testing
  • Operations (Automation, Integration, etc.) and
  • Production Support 
providing the visibility on high priority or expedite items while also sharing the respective status of to do, in progress or done items.  DevOps with Kanban maximizes the productivity with efficient delivery by 
  • Reducing the overall cycle time of delivering services to end user 
  • Identifying bottlenecks with items that are taking a long time in a work stream 
  • Improved tracking of effort and associated costs
  • Identifying recurring work that can be automated 
  • Providing visibility to the end users of when services would be actually delivered 

Summarizing
Primary objective of Kanban is combining productivity with efficiency in developing services while primary objective of DevOps is to achieve continuous delivery by continuously integrating the services developed by the Engineering team and delivering those services with high quality. In summary, embracing Kanban and DevOps allow Organizations to introduce new services more often in a more stable environment. I would be sharing more information in next blog posts including best practices, tools and case studies corresponding to Kanban and DevOps. Meanwhile let us know if you have any questions or comments. For any questions, please reach out to me at sri_ped@yahoo.com